
What is iotop ?
while we are studying about the iotop It become important to understand what is it right ?
so iotop is a command line utility to monitor and check the usage of I/O operations of our disk. You can check official repository or iotop. it was written by Guillaume Chazarain.
iotop watches I/O usage information output by the Linux kernel (requires 2.6.20 or later) and displays a table of current I/O usage by processes or threads on the system.
It displays columns for the I/O bandwidth read and written by each process/thread during the sampling period. It also displays the % of time the thread/process spent while swapping in and while waiting on I/O. For each process, its I/O priority (class/level) is shown.
In addition, the total I/O bandwidth read and written during the sampling period is displayed at the top of the interface.
You can use the left and right arrows to change the sorting, r to reverse the sorting order, o to toggle the –only option, p to toggle the –processes option, a to toggle the –accumulated option, q to quit or i to change the priority of a thread or a process’ thread(s). Any other key will force a refresh.
without making any delay let’s move on the installation of this wonderful tool.
installation of iotop
So, the installation of the iotop is so simple we don’t have to do anything instead firing up a single command according to respective package manager and Linux Distro.
Ubuntu/Debian/Linux Mint:
sudo apt install iotop
# while you've logged in with root user
apt isntall iotop
CentOS/RHEL:
sudo yum install iotop
# or
yum install iotop
Basic Usage of iotop
Using iotop is not much hard until you understand the basics of disk i/o operations. However it is so simple to run it. Just type the below command and you are good to go for exploring the wonderland.
sudo iotop
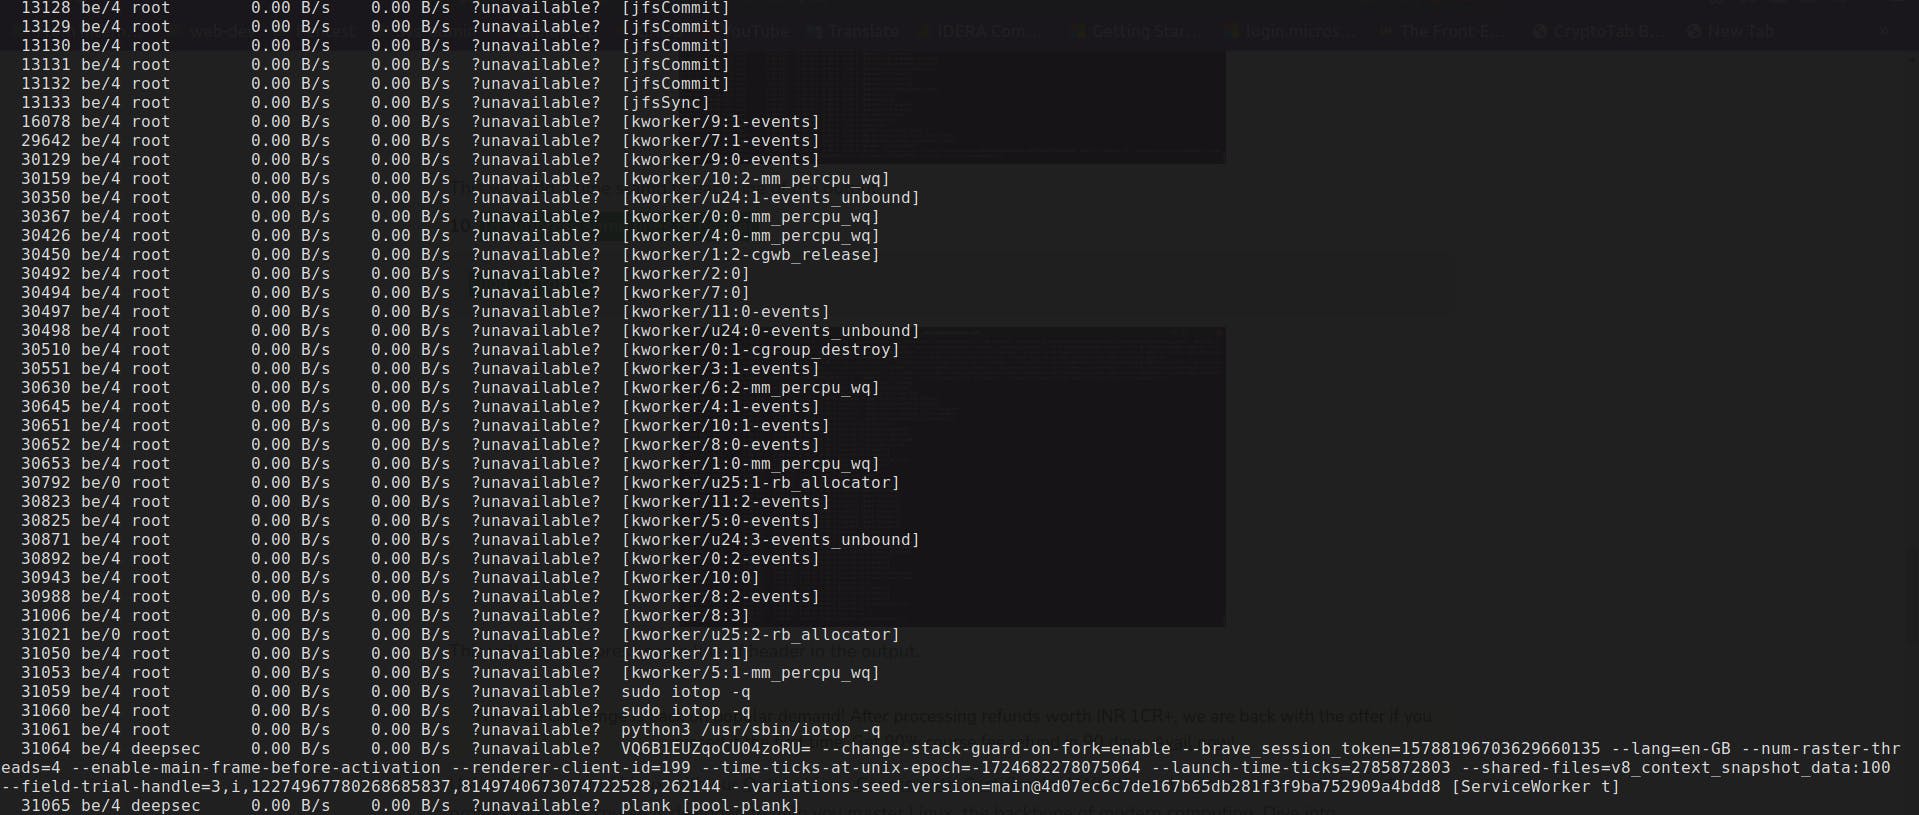
This will display a list of processes along with their disk I/O statistics. The default output includes several important columns which you can see in the image:
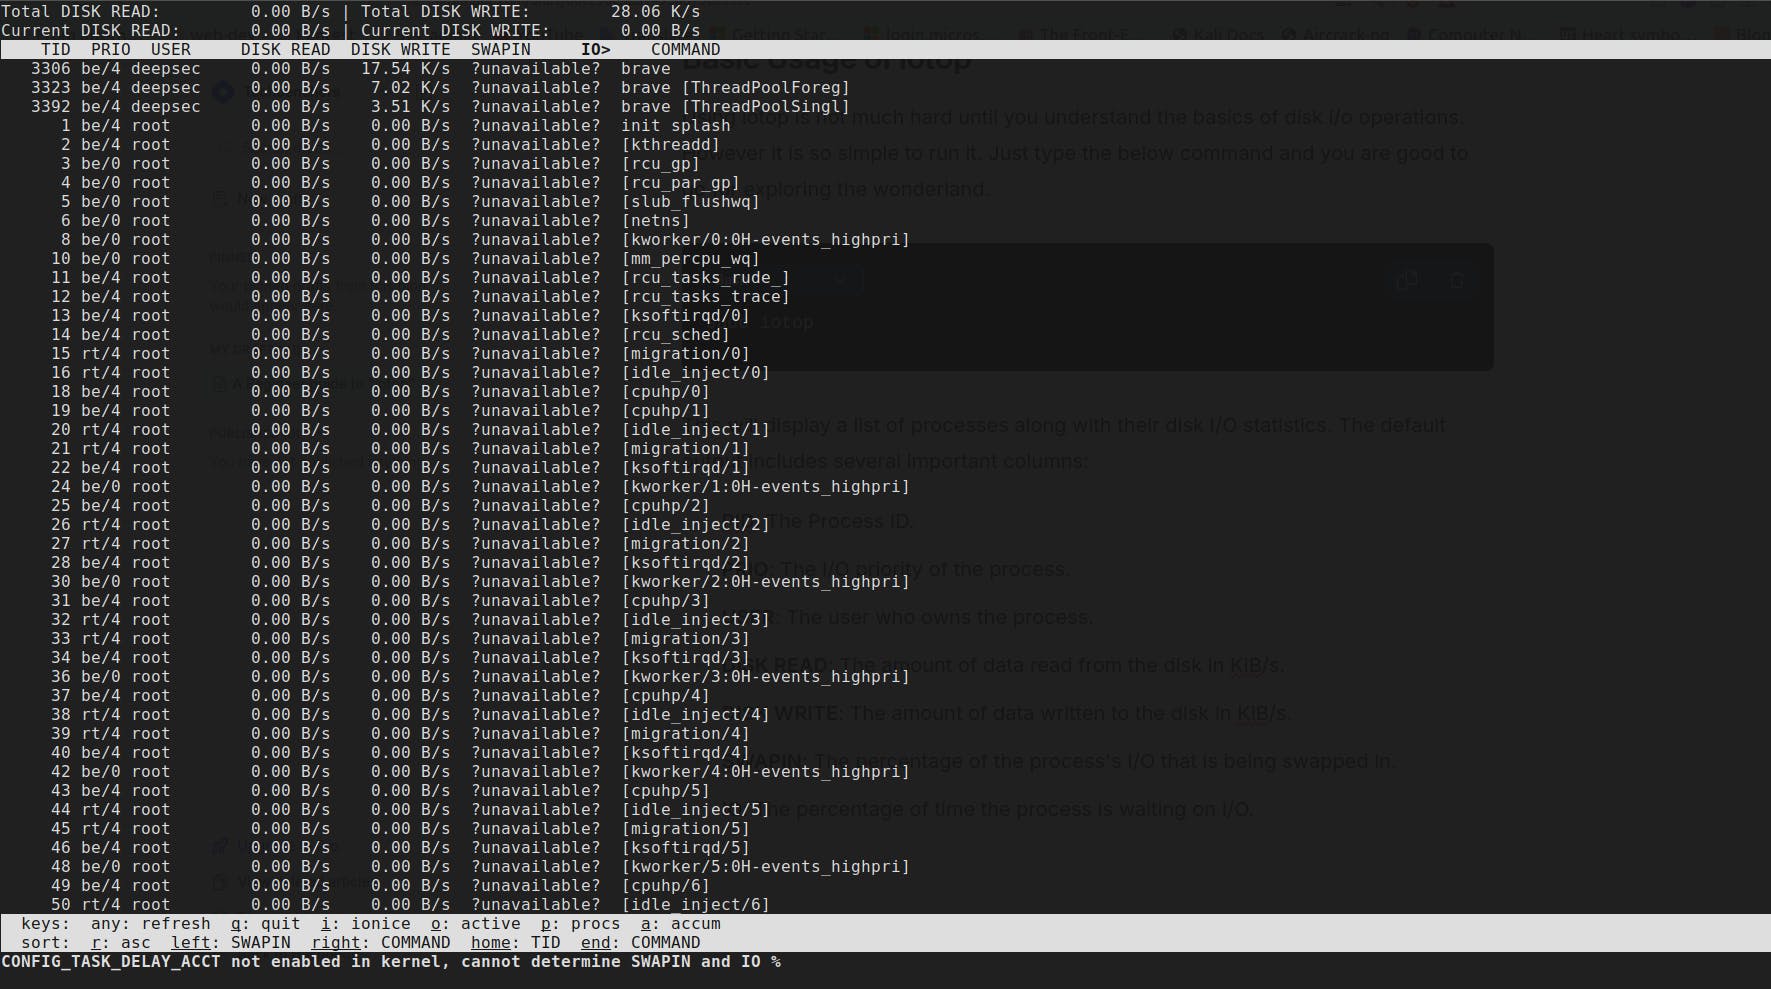
- PID: The Process ID.
- PRIO: The I/O priority of the process.
- USER: The user who owns the process.
- DISK READ: The amount of data read from the disk in KiB/s.
- DISK WRITE: The amount of data written to the disk in KiB/s.
- SWAPIN: The percentage of the process’s I/O that is being swapped in.
- IO: The percentage of time the process is waiting on I/O.
You can navigate within iotop using simple commands:
- Press o to filter and display only processes with active I/O.
- Press
qto quit the program.
Advanced iotop Usage
1. Filtering by User or Process: You can focus on specific users or processes using iotop. For instance, to filter by user, use:
sudo iotop -u username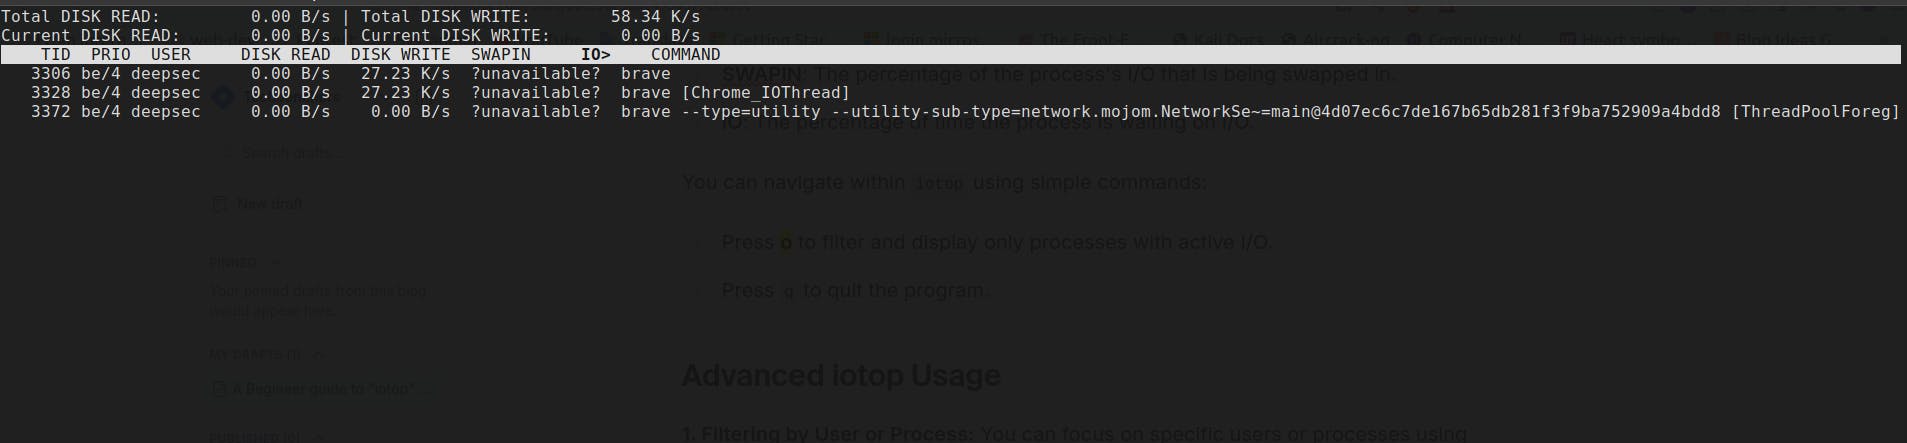
Or to monitor a specific process:
sudo iotop -p PID
# below is my PID 3372
sudo iotop -p 3372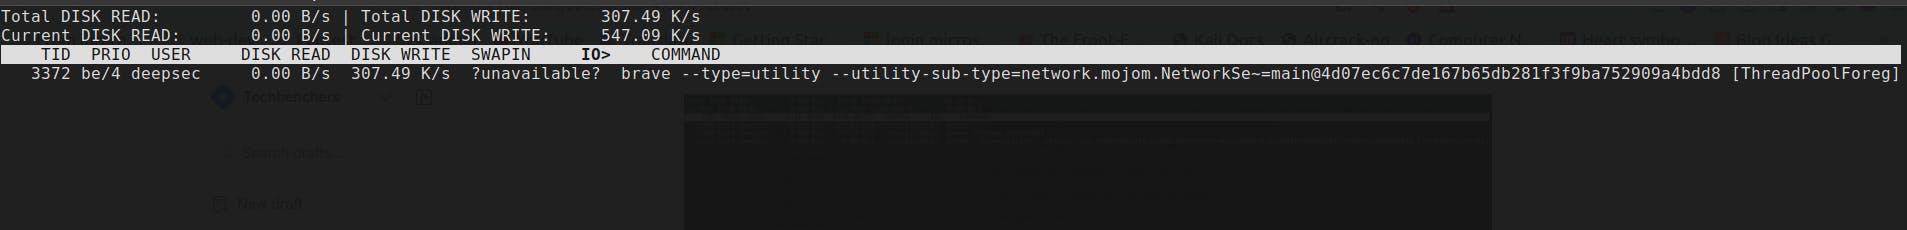
2. Batch Mode for Logging: Running iotop in batch mode allows you to log disk I/O activity for later analysis. This is particularly useful for long-term monitoring or troubleshooting:
sudo iotop -b -o > iotop.log
3. Customising Output: Adjust the delay between updates using -d:
sudo iotop -d 5
Also you can limit the number of iterations with -n:
sudo iotop -n 10
Display values in kilobytes instead of the default megabytes with -k:
sudo iotop -k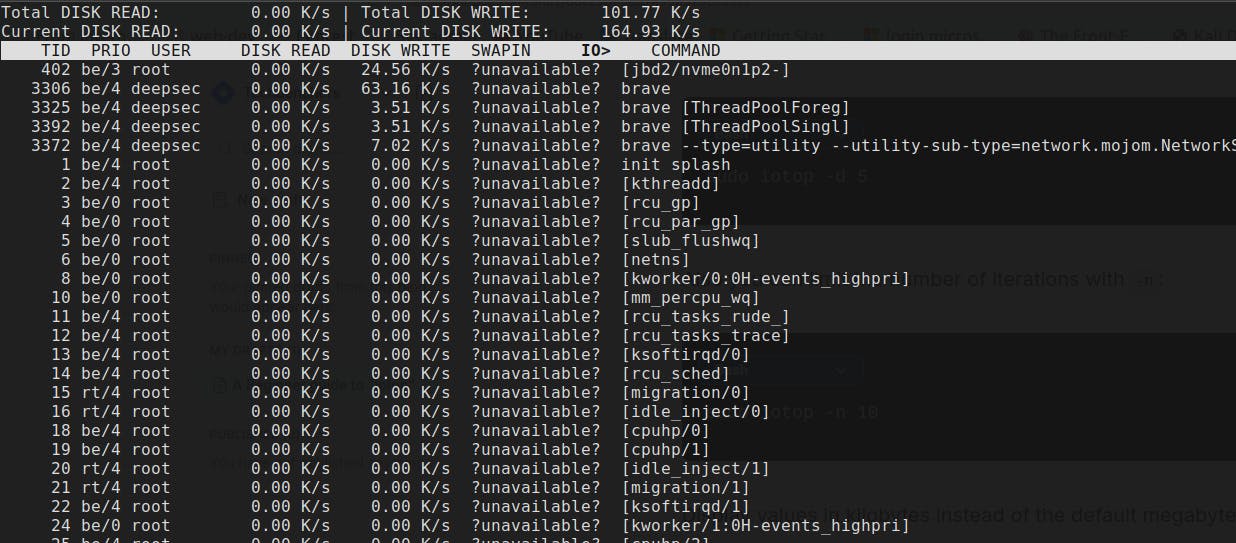
To suppress some lines of header. this will suppress the lines of header.
sudo iotop -q
# This will now suppress some line of header in the output.
4. Combining with Other Tools: For a more automated approach, you can combine iotop with cron to run at regular intervals, or use grep to filter the output for specific patterns:
sudo iotop -b -o | grep 'pattern' > filtered_iotop.log
Optimizing Disk Performance Using iotop
1. Identifying and Terminating Problematic Processes: If iotop reveals a process that’s consuming too much I/O, you can terminate it to free up resources:
sudo kill -9 PID
2. Adjusting I/O Priorities: For processes that need to run but are consuming too much I/O, you can adjust their I/O priority using ionice:
sudo ionice -c3 -p PID
This command will set the process to the “idle” priority class, meaning it will only use disk I/O when the system is otherwise idle.
3. Proactive Monitoring: Set up alerts based on iotop output to catch I/O issues early. For example, you can use a monitoring script that sends an email or triggers an alert if disk I/O crosses a certain threshold.
4. Regular Analysis: Make it a habit to run iotop periodically, especially if you notice performance issues. Regular monitoring helps you catch problems early, ensuring your system runs smoothly.
Use Cases of iotop
Below are some use cases that you can consider for using iotop which can be helpful in a lot ways.
1. Identifying Disk I/O Bottlenecks: High disk I/O can cause significant slowdowns in system performance. With iotop, you can quickly identify which processes are consuming the most I/O resources. For example, if your system is sluggish, running iotop can help you pinpoint processes that are hogging the disk, allowing you to take appropriate action.
2. Monitoring Performance of Disk-Intensive Applications: Applications like databases, backup processes, or large file transfers are always very disk-intensive. Using iotop, you can monitor these applications in real-time, ensuring they aren’t causing unnecessary strain on your system or interfering with other processes.
3. Diagnosing Swap Usage Issues: If your system is heavily using swap, it can lead to increased disk I/O, slowing down your system. iotop helps you monitor swap usage as well and identify processes that are causing excessive swapping and enabling you to optimise memory usage and reduce swap dependence.
4. Analysing Disk Write Patterns: Understanding which processes are writing heavily to disk can help in managing disk wear, especially for SSDs. iotop provides a clear view of disk write activity, making it easier to manage disk health and longevity.
I hope you’ve enjoyed this article on iotop, you can also use some resources mentioned below to expand your understanding on iotop.